Unleashing data agility: A practical approach to schema changes in ClickHouse
2023-12-12
Post by: Anton Friberg

It is difficult to account for unknown factors when constructing your data schema. In some cases, you need to be able to change it later and retroactively apply it to historic data.
Some Background
It is important to note that the content within this posts reflects challenges, solutions, and viewpoints of a specific team. Both Elasticsearch and ClickHouse® are both used extensively for different use-cases around the organization. Outside of that, Elastic and ClickHouse are not affiliated with Axis Communications.
Axis believes in fostering an environment where different teams and individuals can explore innovative solutions tailored to their specific needs, contributing to our collective growth and knowledge sharing. We hope that this page will be able to do that outside the organization as well.
With that in mind, let us continue!
Table of Contents
Introduction
At Axis, we have developed our own solution to collect diagnostics data based on user consent, in order to continue to improve our users’ experiences and the long-term stability of our devices. Our goal is to provide essential information to our engineers, enabling them to make confident and swift changes, despite working with a diverse portfolio of over 300 products, each with different use cases, hardware, and software capabilities. The data collection process is optional, ensures anonymity, and plays a crucial role in our connected services, which are designed to enhance the overall end-user experience.
Over the years, our data platform has undergone several iterations. One significant change was our decision to reevaluate how we manage data, transitioning from storing and managing unstructured or semi-structured data in Elasticsearch to well-structured tables in ClickHouse. This shift allows more individuals within our organization to extract valuable and actionable insights from the data, without requiring extensive domain-specific knowledge.

However, this transition also presented us with a fundamental challenge in handling structured data—capturing and managing unanticipated data or outliers. To address this, we devised a practical solution that offers structured data views while still allowing for the ingestion of previously unseen data.
After multiple iterations, we have adopted a short-lived ingest table approach. This table includes structured columns for device metadata, with the data itself stored as a JSON string. Using ClickHouse Materialized Views, we parse the data according to the defined schema provided by the data producers.
In this page, we will provide an overview of our collection architecture. We will explain how data is inserted into ClickHouse and discuss our strategies for managing the dynamic nature of data and the limitations of this approach.
Data Architecture

The diagram above provides a high-level overview of the data architecture, specifically focusing on its role in collecting and storing diagnostic metrics and logs from devices.
In this context, a device refers to an embedded Linux® device.
The data is collected in the form of raw, unstructured documents. This means that we can ingest data regardless of its format while ensuring data integrity. The responsibility of the data producer goes beyond generating the raw documents from the device; they also need to provide instructions on how the documents should be parsed, along with a high-level schema that includes descriptions and data types for the fields. As the data progresses to the right in the diagram, more structure is imposed on it.
This approach allows us to maintain flexibility at the point of data ingestion, enabling us to capture and investigate outliers. At the same time, it facilitates efficient long-term storage, offering excellent query performance and the ability to handle schema migrations at the consumption stage.
To illustrate this concept, let’s examine a simplified version of a metric called “meminfo”. It’s important to note that the architecture is designed to accommodate any type of data that needs to be collected throughout its development life cycle.
Beginnings – Raw Text Documents
The data collection process starts with raw text on the device. This raw text, which consists of outputs from various parts of the Linux system, is collected and stored in a short-lived object storage bucket. These documents are stored for a short period of time, giving us the chance to investigate any significant parsing issues that may arise downstream.
One specific metric, meminfo, originates from the /proc/meminfo output. Although this output appears to have a structured format, at this stage of the pipeline, we treat the entire output as a single string without performing any validation or parsing.
Here’s an example of the /proc/meminfo output:
$ cat /proc/meminfo | head -n 3
MemTotal:       654321 kB
MemFree:        123456 kB
MemAvailable:   321456 kB
However, storing data in this manner is highly inefficient, as you may already know. While compression can partially mitigate the issue, it doesn’t fully address the long-term storage problem. Consequently, we have decided to limit the storage duration to four weeks. This timeframe allows us sufficient opportunity to identify any data issues downstream, while still retaining the ability to review the data as it appeared on the device within that specific time period.
To store the data more efficiently, we need to parse and extract the relevant information that we actually care about.
Minimal structure – Partitioned Parquet Files
In the next step of the process, we transform the raw documents to extract valuable information and organize them into keys and values. During this step, we don’t validate the data or perform any type-casting. This means that invalid or empty inputs are allowed to propagate downstream.
After the transformations, we end up with optimized chunks of compressed Apache Parquet files. This reduces complexity and greatly improves the compression ratio, allowing us to store the data for longer. The simple structure ensures a stable data schema that doesn’t require any changes, even if the underlying data changes.
This format gives us complete flexibility in managing changes related to both the collection context and the collected data itself. It provides an efficient storage format that can be stored over an extended period. Importantly, it even allows us to have multiple versions of any given metric stored together without issues.
To explore the structure of the files, we can use the excellent clickhouse-local tool. Please note that the outputs have been simplified for easier understanding.
$ clickhouse local
ClickHouse local version 23.5.1.1100 (official build).
ch01 :) SELECT * FROM file('./x0000.parquet') WHERE metricstype = 'meminfo' LIMIT 1 FORMAT Vertical

Row 1:
──────
device_metadata: device_id="ABC" boot_id="<UUID>" firmware_version="10.x" ...
metrics_data:    mem_total=654321 mem_free=123456 mem_available=321456 ...
data_dump:
environment:     main
metricstype:     meminfo
timestamp:       2023-02-02T03:05:39Z
type:            kv

ch01 :) DESCRIBE TABLE file('./x0000.parquet')

┌─name─────────────────┬─type─────────────┐
│ device_metadata      │ Nullable(String) │
│ metrics_data         │ Nullable(String) │
│ data_dump            │ Nullable(String) │
│ environment          │ Nullable(String) │
│ metrics_type         │ Nullable(String) │
│ timestamp            │ Nullable(String) │
│ encoding_type        │ Nullable(String) │
└──────────────────────┴──────────────────┘
The column named device_metadata contains information about the device that generated the data. The metrics_data column includes various metrics that were collected. Each collection event results in multiple rows of data for each device. These rows may have duplicate device_metadata, but they will have different metrics_type and metrics_data, representing diverse data sources on the device.
Examples of metrics types include CPU load average, memory usage, temperature, and error logs. The timestamp, indicating when the data was generated, is crucial for managing the data as it moves through the system, so it is placed in a separate column.
The environment field serves as a label to differentiate between production and development instances of the data platform. The data_dump field allows passing data through the entire pipeline without modifications, this is useful for binary debug information.
Lastly, the encoding_type field specifies the format in which the structured columns of device_metadata and metrics_data are encoded, such as “json” or “kv” (key=value).
The data is stored on inexpensive object storage, enabling long-term storage or even deep archiving. However, at this stage, the data lacks value for our data consumers. It is difficult to work with and lacks convenient filtering options beyond the hourly partition. To facilitate unrestricted exploration of our data, we must ingest it into a database designed for analytical workloads. This is where ClickHouse comes into the picture, enabling efficient and effective analysis of the data.
Device Metadata Structure – ClickHouse Ingest Table
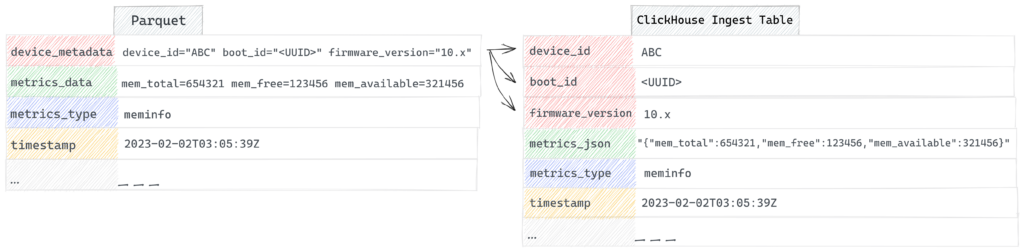
The Parquet data is processed and inserted into ClickHouse’s Ingest table using an ETL job. Rather than simply taking the data as is, the ETL job extracts each key-value pair from the device_metadata field and inserts it into the corresponding ClickHouse column. While the device metadata fields rarely change, we have the ability to backfill by resetting the ClickHouse tables and reingesting the files through the ETL job if necessary.
In ClickHouse, the table is partitioned based on the year-month of the timestamp, and the data is sorted according to metrics_type, firmware_version, device_id, boot_id, and timestamp. The sorting order in ClickHouse aligns with the primary index, which ensures efficient filtering on these columns. Additionally, the sort order has another significant advantage. It groups data from the same device in the order of each collection event, resulting in improved compression ratios, reduced storage space, and faster query speeds. Especially if the memory usage is stable on the device itself. This aspect is quite fascinating!
Through a combination of the sort order, efficient data types, compression algorithms, and encoding codecs, the final size of the table can be compressed to approximately 1.2% compared to the uncompressed data size. The device metadata columns are duplicated due to multiple metrics resulting from each collection trigger, but thanks to column compression, the storage overhead is completely eliminated.
A slightly simplified view of the Ingest table is as follows.
CREATE TABLE ingest (
  metrics_json Nullable(String) CODEC(ZSTD),
  metrics_type LowCardinality(String) DEFAULT 'unknown' CODEC(ZSTD),
  device_id String DEFAULT 'unknown' CODEC(ZSTD),
  boot_id String DEFAULT 'unknown' CODEC(ZSTD),
  firmware_version LowCardinality(String) DEFAULT 'unknown' CODEC(ZSTD),
  timestamp DateTime CODEC(DoubleDelta, ZSTD),
)
ENGINE = ReplicatedMergeTree PARTITION BY toYYYYMM(timestamp)
ORDER BY (metrics_type, firmware_version, device_id, boot_id, timestamp)
TTL timestamp + toIntervalMonth(2);
The Ingest table serves as a storage for data, retaining it for a period of 2 months. During this time, we maintain the flexibility to evolve the schema for metrics data and even device metadata since we can reingest data from the Parquet files if necessary. This ensures data integrity even if the schema doesn’t match downstream requirements. Moreover, this setup enables us to identify unexpected behavior or anomalies in the incoming data and determine the extent of the issue across different dimensions of device metadata such as firmware, product line, or device.
An important aspect of this setup is its ability to accept metrics data even before the data schema is fully defined. We can begin collecting data from a device, perform a best-effort parsing, and consult the Ingest table in ClickHouse. This approach works well as long as we only need to analyze data for a limited time period. To efficiently query data over a longer duration, it becomes necessary to establish a consistent schema for the metrics fields themselves. To achieve this, we leverage Materialized Views.
Full Structure – ClickHouse Metrics Tables
The Ingest table structure in ClickHouse enables querying the data when needed. However, we face typical challenges with unstructured data for the metrics data. In order for our users to extract insights more easily we need to extract and transform the unstructured data into well-structured tables specific for each metric.
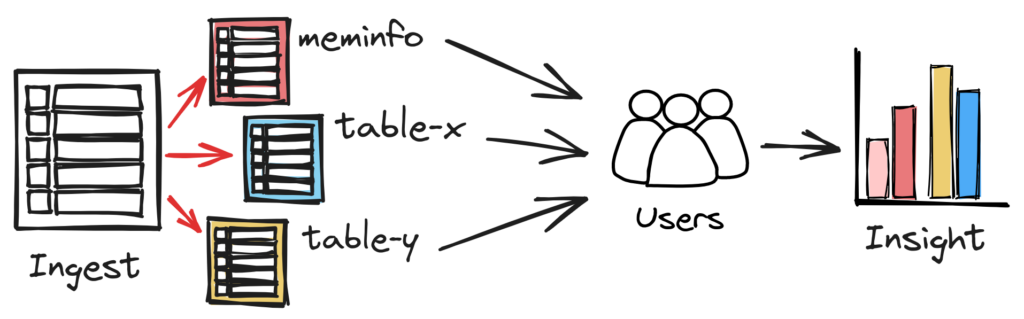
To be able to do this, we employ ClickHouse Materialized Views. Materialized Views can be viewed as ingest triggers that execute select statements on the inserted data chunk and insert the result into another table. The materialized views are visualized as red arrows in the figure above.
In our simplified example, we define the metric table as follows and utilize the Materialized View to populate the metrics table:
-- Create the metric table that actually stores the data
CREATE TABLE IF NOT EXISTS meminfo (
-- Metric Columns
  mem_total Nullable(Int64) Codec(ZSTD),
  mem_free Nullable(Int64) Codec(ZSTD),
  mem_available Nullable(Int64) Codec(ZSTD),
-- Device Metadata Columns
  device_id String DEFAULT 'unknown' Codec(ZSTD),
  boot_id String DEFAULT 'unknown' Codec(ZSTD),
  firmware_version LowCardinality(String) DEFAULT 'unknown' Codec(ZSTD),
  timestamp DateTime Codec(DoubleDelta, ZSTD),
)
ENGINE = ReplicatedMergeTree PARTITION BY toYYYYMM(timestamp)
ORDER BY (
  firmware_version,
  device_id,
  boot_id,
  timestamp
);

-- Create the 'insert trigger' that selects from ingest and inserts into metric table
CREATE MATERIALIZED VIEW meminfo_view TO meminfo AS
SELECT
-- Extract metrics columns
  JSONExtractRaw(metrics_json, 'mem_total') AS mem_total,
  JSONExtractRaw(metrics_json, 'mem_free') AS mem_free,
  JSONExtractRaw(metrics_json, 'mem_available') AS mem_available,
-- Take device metadata columns from table directly
  device_id,
  boot_id,
  firmware_version,
  timestamp
FROM ingest
WHERE
  metrics_type = 'meminfo' AND
  isNotNull(metrics_json) AND
  isValidJSON(metrics_json);
By leveraging Materialized Views, we can effectively organize and present the metrics data in a structured manner, ensuring easier analysis and retrieval of relevant information.
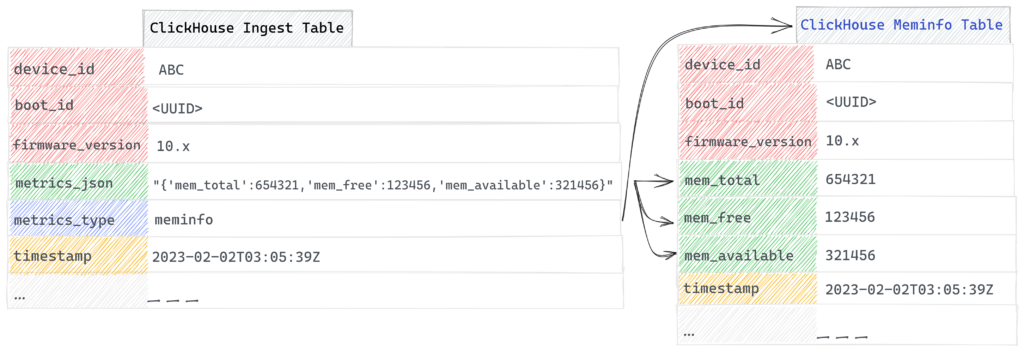
The SQL syntax above can also be visualized like below.
The purpose of the metrics tables is to store data for a long period while ensuring efficient querying of all the data. To achieve this, we employ several strategies. Firstly, we enforce a strict schema that utilizes more efficient data types, thereby reducing the storage requirements. Secondly, we optimize the columns further with individual selection of compression algorithms and codecs. In combination, this achieves drastic storage savings and as a result also greatly enhances the query speed for those metrics.
Furthermore, our system employs materialized views to handle various formats of incoming data effortlessly. By creating multiple materialized views or utilizing advanced select statements, we can effectively manage different data formats within the system. This approach provides us with flexibility and allows for seamless processing of diverse data sources.
Managing Changes
To highlight the benefits of this approach, let’s consider a simple case where the data producer wants to add support for an additional meminfo field.
$ cat /proc/meminfo | head -n 4
MemTotal:       654321 kB
MemFree:        123456 kB
MemAvailable:   321456 kB
Buffers:          1234 kB
The data producer can start by modifying the collection code that runs on the devices and deploying it. Interestingly, there is no need to modify the transformation code because it was written in a generic manner to handle any additional data point. As a result, the new field will automatically be populated alongside the existing fields in the Apache Parquet files.
$ clickhouse local
ClickHouse local version 23.5.1.1100 (official build).
ch01 :) SELECT * FROM file('./x0000.parquet') WHERE metricstype = 'meminfo' LIMIT 1 FORMAT Vertical

Row 1:
──────
device_metadata: device_id="ABC" boot_id="<UUID>" firmware_version="10.x" ...
metrics_data:    mem_total=654321 mem_free=123456 mem_available=321456 buffers=1234
data_dump:
environment:     main
metricstype:     meminfo
timestamp:       2023-02-03T04:02:12Z
type:            kv
This then continues downstream into the ClickHouse ingest Table.
ch01 :) SELECT * FROM ingest WHERE metrics_type = 'meminfo' LIMIT 1 FORMAT Vertical

Row 1:
──────
metrics_json:     {"mem_total": 654321, "mem_free": 123456, "mem_available": 321456, "buffers": 1234}
metrics_type:     meminfo
device_id:        ABC
boot_id:          <UUID>
firmware_version: 10.x
timestamp:        2023-02-03T04:02:12Z
Here the data producer can allow others to review and validate the changes. Importantly, this entire process does not require any modifications to the underlying data architecture itself. Once the data producer determines that the changes are satisfactory, the migration code for the meminfo table and materialized view can be constructed to finalize the change.
-- Drop the Materialized View
DROP TABLE meminfo_view SYNC;

-- Add buffers to meminfo metric table
ALTER TABLE meminfo ADD COLUMN buffers Nullable(Int64) Codec(ZSTD) AFTER mem_available;

-- Recreate the Materialized View
CREATE MATERIALIZED VIEW meminfo_view TO meminfo AS
SELECT
-- Extract metrics columns
  JSONExtractRaw(metrics_json, 'mem_total') AS mem_total,
  JSONExtractRaw(metrics_json, 'mem_free') AS mem_free,
  JSONExtractRaw(metrics_json, 'mem_available') AS mem_available,
  JSONExtractRaw(metrics_json, 'buffers') AS buffers,
-- Take device metadata columns from table directly
  device_id,
  boot_id,
  firmware_version,
  timestamp
FROM ingest
WHERE
  metrics_type = 'meminfo' AND
  isNotNull(metrics_json) AND
  isValidJSON(metrics_json);

-- Drop current partition and reingest if backfilling is necessary
ALTER TABLE meminfo DROP PARTITION '202302';

INSERT INTO meminfo SELECT (
  JSONExtractRaw(metrics_json, 'mem_total') AS mem_total,
  JSONExtractRaw(metrics_json, 'mem_free') AS mem_free,
  JSONExtractRaw(metrics_json, 'mem_available') AS mem_available,
  JSONExtractRaw(metrics_json, 'buffers') AS buffers,
  device_id,
  boot_id,
  firmware_version,
  timestamp
)
FROM ingest
WHERE
  toYYYYMM(timestamp) = '202302' AND
  metrics_type = 'meminfo' AND
  isNotNull(metrics_json) AND
  isValidJSON(metrics_json);
It’s worth noting that ClickHouse does not support transactions, so we recommend halting data ingest during the migration process to ensure data integrity.
Limitations
Before adopting this approach, it is important to be aware of its limitations. Firstly, you should have a good understanding of the limitations of ClickHouse itself. It is crucial to insert large chunks of data at a time and select a suitable partition key. A combination of sub-optimal insertion chunks and excessive use of Materialized Views can result in issues like “Too many parts” errors. ClickHouse has provided a detailed overview of this problem in their blog post titled “13 Deadly Sins and how to avoid them“. Additionally, relying on Materialized Views can cause problems as the data scales, so it is essential to have a thorough understanding of how they work. A valuable resource for this is the commented slide deck by Denis Zhuralev.
Secondly, this setup requires some manual work to ensure optimal performance. The data producers will provide a schema for interpreting their data, but a collaborative effort is needed to create schema migration commands for both the metric tables and the Materialized Views. Initially, this process can be cumbersome, but many of the issues can be addressed by automatically generating preliminary drafts of the schema migrations. Currently, we achieve this by comparing the desired schema provided by the data producer with the existing schema in ClickHouse. We aim to share more about this solution in a future post, once it becomes more robust.
Furthermore, it is important to note that the setup can lead to performance degradation depending on the sort order of the Parquet files being inserted. This issue is more complex and requires careful understanding. The journey from identifying this issue to finding a solution is significant enough to warrant its own story.
Final Thoughts
In conclusion, we think this data architecture is a practical approach to address the challenges of collecting and managing data from a diverse range of devices and sources. It allows us to continuously scale and tweak each component of the system as needed while still allowing each metric to transition between different levels of maturity. It provides our engineers with the necessary tools to extract valuable insights and make informed decisions confidently.
With the migration from Elasticsearch into ClickHouse and Materialized Views, we achieved a harmonious balance between structured data and the ability to handle unanticipated information, driving continuous improvements both for the data itself but also across our entire product portfolio.
If you read up until this point you probably find these types of challenges just as interesting as we do. You should know that we are constantly looking for skilled engineers to join our team and the rest of the company. Please keep an eye open on our career page or check out any open positions here!
Linux® is the registered trademark of Linus Torvalds in the U.S. and other countries.
ClickHouse is a registered trademark of ClickHouse, Inc. https://clickhouse.com.
Elasticsearch is a trademark of Elasticsearch BV, registered in the U.S. and in other countries.